
How to measure influencer campaign results, from coverage to the final report
The KPIs for an influencer campaign: confirmed visits, publish rate, views, engagement rate, cost per view and per-branch results, and how to build one client report.
The short answer
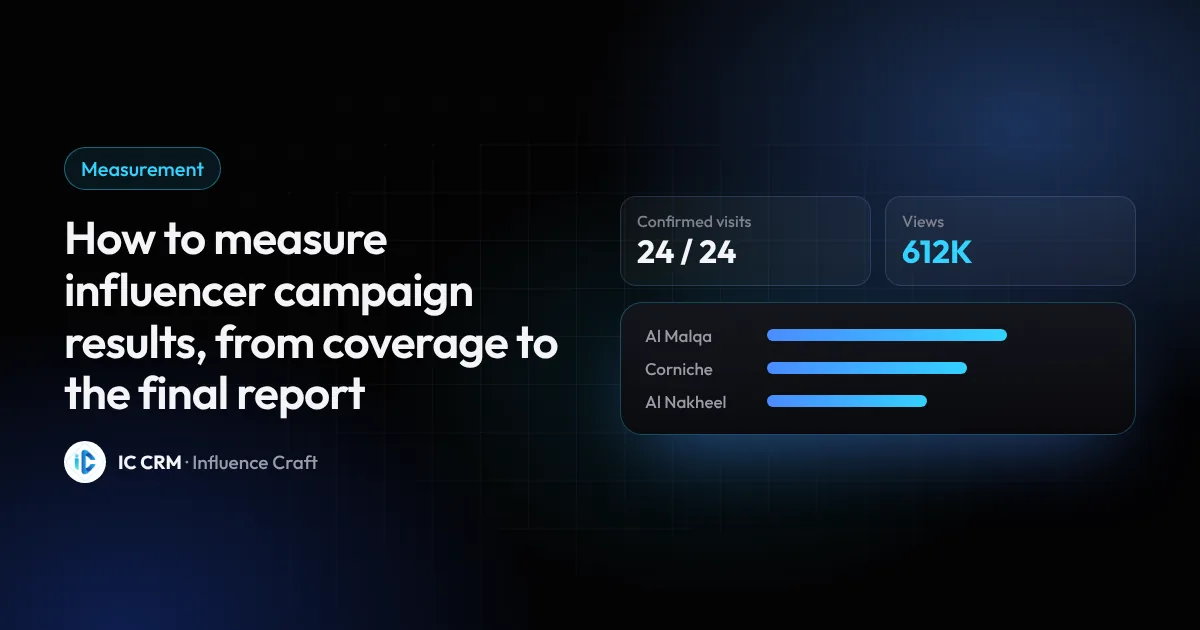
Measure a campaign on five KPIs: confirmed visits, publish rate (how many creators published out of those who visited), total views, engagement rate by views, and cost per view when the budget is known. Collect the numbers from the content links themselves, not from screenshots, and present them in one report broken down by creator, platform and branch.
Agree on measurement before launch
The most common mistake is launching first and asking "how do we measure this?" at the end. Agree with the client up front on:
- The main goal: visits, views or engagement.
- The KPIs that will appear in the report.
- How visits will be proven and how content numbers will be collected.
- When numbers will be captured, for example 7 days after publishing.
The core KPIs
| KPI | How it's calculated | What it tells you |
|---|---|---|
| Confirmed visits | Visits proven by QR | Whether the visits really happened |
| Publish rate | Posts ÷ confirmed visits × 100 | Whether creators delivered |
| Total views | Sum of views on all published content | Actual reach |
| Engagement rate | (likes + comments + shares + saves) ÷ views × 100 | Whether people engaged or just scrolled |
| Cost per view | Budget ÷ total views | Spend efficiency |
Collect numbers at the source
Screenshots sent by creators are easy to edit and hard to aggregate. Add the link of every published piece and collect its numbers from the link at a fixed time for every post. Watch for:
- Capturing numbers at the same point after publishing for every creator, so comparisons are fair.
- Recording the capture date in the report.
- Separating Stories from permanent posts, since Stories disappear after 24 hours.
Break the results down
A single total is not enough to decide anything. Break results down by:
- Creator: who delivered the best views and engagement for their cost.
- Platform: where performance was strongest.
- Branch: for multi-branch brands, which branch benefited most.
- Content type: video, Story or post.
What the report should include
- A two-line summary at the top: what the campaign achieved.
- The five KPIs against the target.
- A table per creator: the visit, the content, the numbers.
- Results by branch and platform.
- What worked, and what to change next time.
Common mistakes
- Counting posts instead of their results.
- Mixing temporary Story numbers with permanent posts without saying so.
- Capturing numbers at different times for different creators.
- A long report with no clear takeaway for the client.
FAQ
When should I capture content numbers after publishing?
Pick a fixed point for every post, such as 7 days after publishing, so creator comparisons are fair.
Are views enough to judge a campaign?
No. Views measure reach; engagement rate, confirmed visits and publish rate complete the picture.
How do I calculate cost per view?
Divide the campaign budget by total views. You can also calculate it per creator to find the most efficient ones.
What about Stories that disappear?
Agree in advance on documenting their insights, and show them in the report separately from permanent posts.



Ready to see your next campaign in numbers?
Request a demo and we’ll walk you through the platform step by step, from campaign setup to the final report.